Genetic optimization of a risk stratification system for thyroid nodules
Thyroid nodules
Thyroid nodules are estimated to affect as much as 50% of the population. Triaging them for biopsy is done based on assessment of ultrasound imaging by radiologists. A system that quantifies the features and provides a recommendation decision proposed by the American College of Radiology (ACR) is called Thyroid Imaging Reporting and Data System (TI-RADS) [1]. ACR TI-RADS was extensively tested in multiple studies which showed its superior performance as compared to other similar risk stratification systems. Still, it was built based on evidence in the literature and expert consensus. We, in turn, developed an improved version using a data-driven approach based on genetic optimization methods and data for 1425 thyroid nodules. An interactive website for our system is available at deckard.duhs.duke.edu/~ai-ti-rads/.
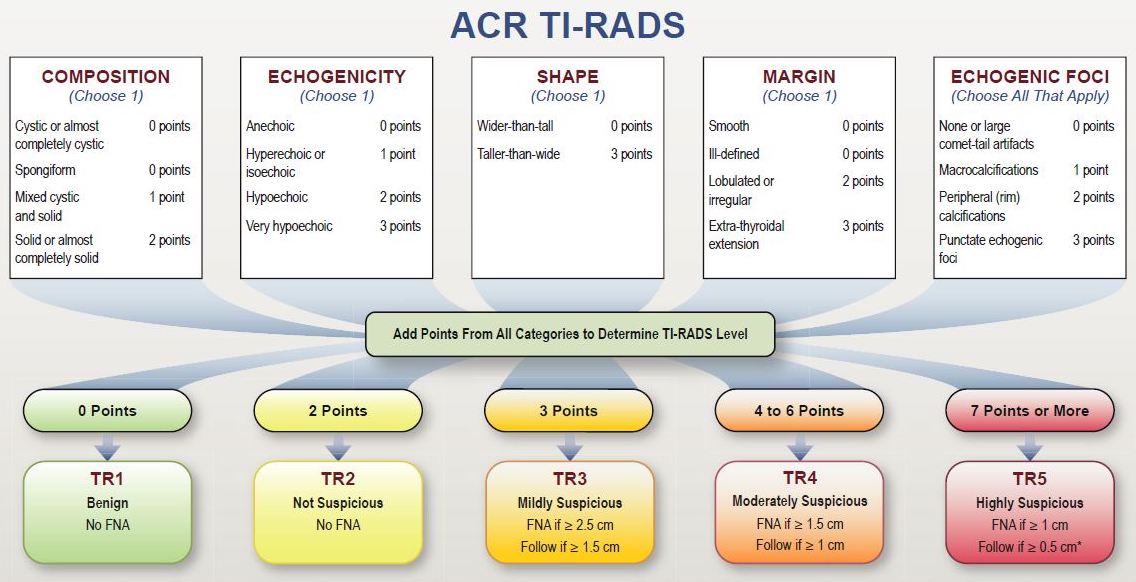
Figure 1: ACR TI-RADS framework introduced in [1]. (FNA = fine needle aspiration biopsy)
Data
Our dataset included 1425 thyroid nodules from 1264 patients. All nodules were assigned ground truth labels (benign or cancer) proven by either biopsy or surgery. Each nodule was assessed for the five ACR TI-RADS feature categories (shown in Figure 1) by a single radiologist, expert in thyroid imaging. For testing, we selected 100 cases that were additionally annotated by multiple radiologists. The remaining 1325 cases were used for algorithm development.
Genetic algorithm
Code repository for a genetic optimization algorithm applied in this project is available at the following link: github.com/mateuszbuda/AI-TI-RADS. It was implemented using Python package DEAP for distributed evolutionary algorithms. The main steps of the algorithm are:
1. initialize population with 100 individuals
2. for 50 generations:
    a. select individuals to create offspring population
    b. crossover randomly selected offspring individuals
    c. mutate randomly selected offspring individuals
3. return individual with the best loss function
An individual was represented with a vector of 19 integer variables with values in a range from 0 to 3, each corresponding to one feature in ACR TI-RADS. Points for two features (anechoic echogenicity and extra-thyroidal extensions margin) were adapted from ACR TI-RADS since we did not have any case with these features in our dataset. Two other features (cystic and spongiform composition) were excluded since in ACR TI-RADS these nodules receive 0 points in total without adding further points for other categories.
In the initial population, all individuals were representing the assignment of points as in ACR TI-RADS.
For selection (step 2a) we used a tournament approach of size 4. Among 4 randomly drawn individuals, we selected one with the best fitness function. This procedure was repeated 100 times in each generation.
The crossover (step 2b) was an exchange of the values between two randomly selected variables. The probability of an individual being subject to crossover with another individual was set to 50%.
The mutation (step 2c) assigned a new random value to a variable. The probability of mutation was set to 20% for an individual and 5% for a variable.
Finally, the optimized loss function used for evaluation of individuals was area under the ROC curve (AUC). The progress of evolution is shown in Figure 2.
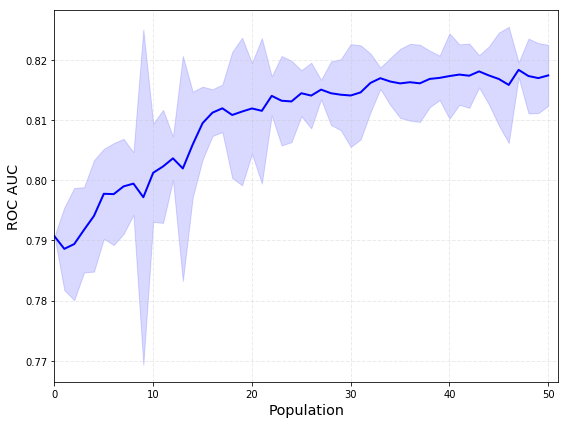
Figure 2: Mean and standard deviation for AUC of a population across evolution.
Results
The optimization resulted in AI TI-RADS with new point assignments for the features as shown in Figure 3. Interactive calculator for AI TI-RADS is available online: deckard.duhs.duke.edu/~ai-ti-rads/.
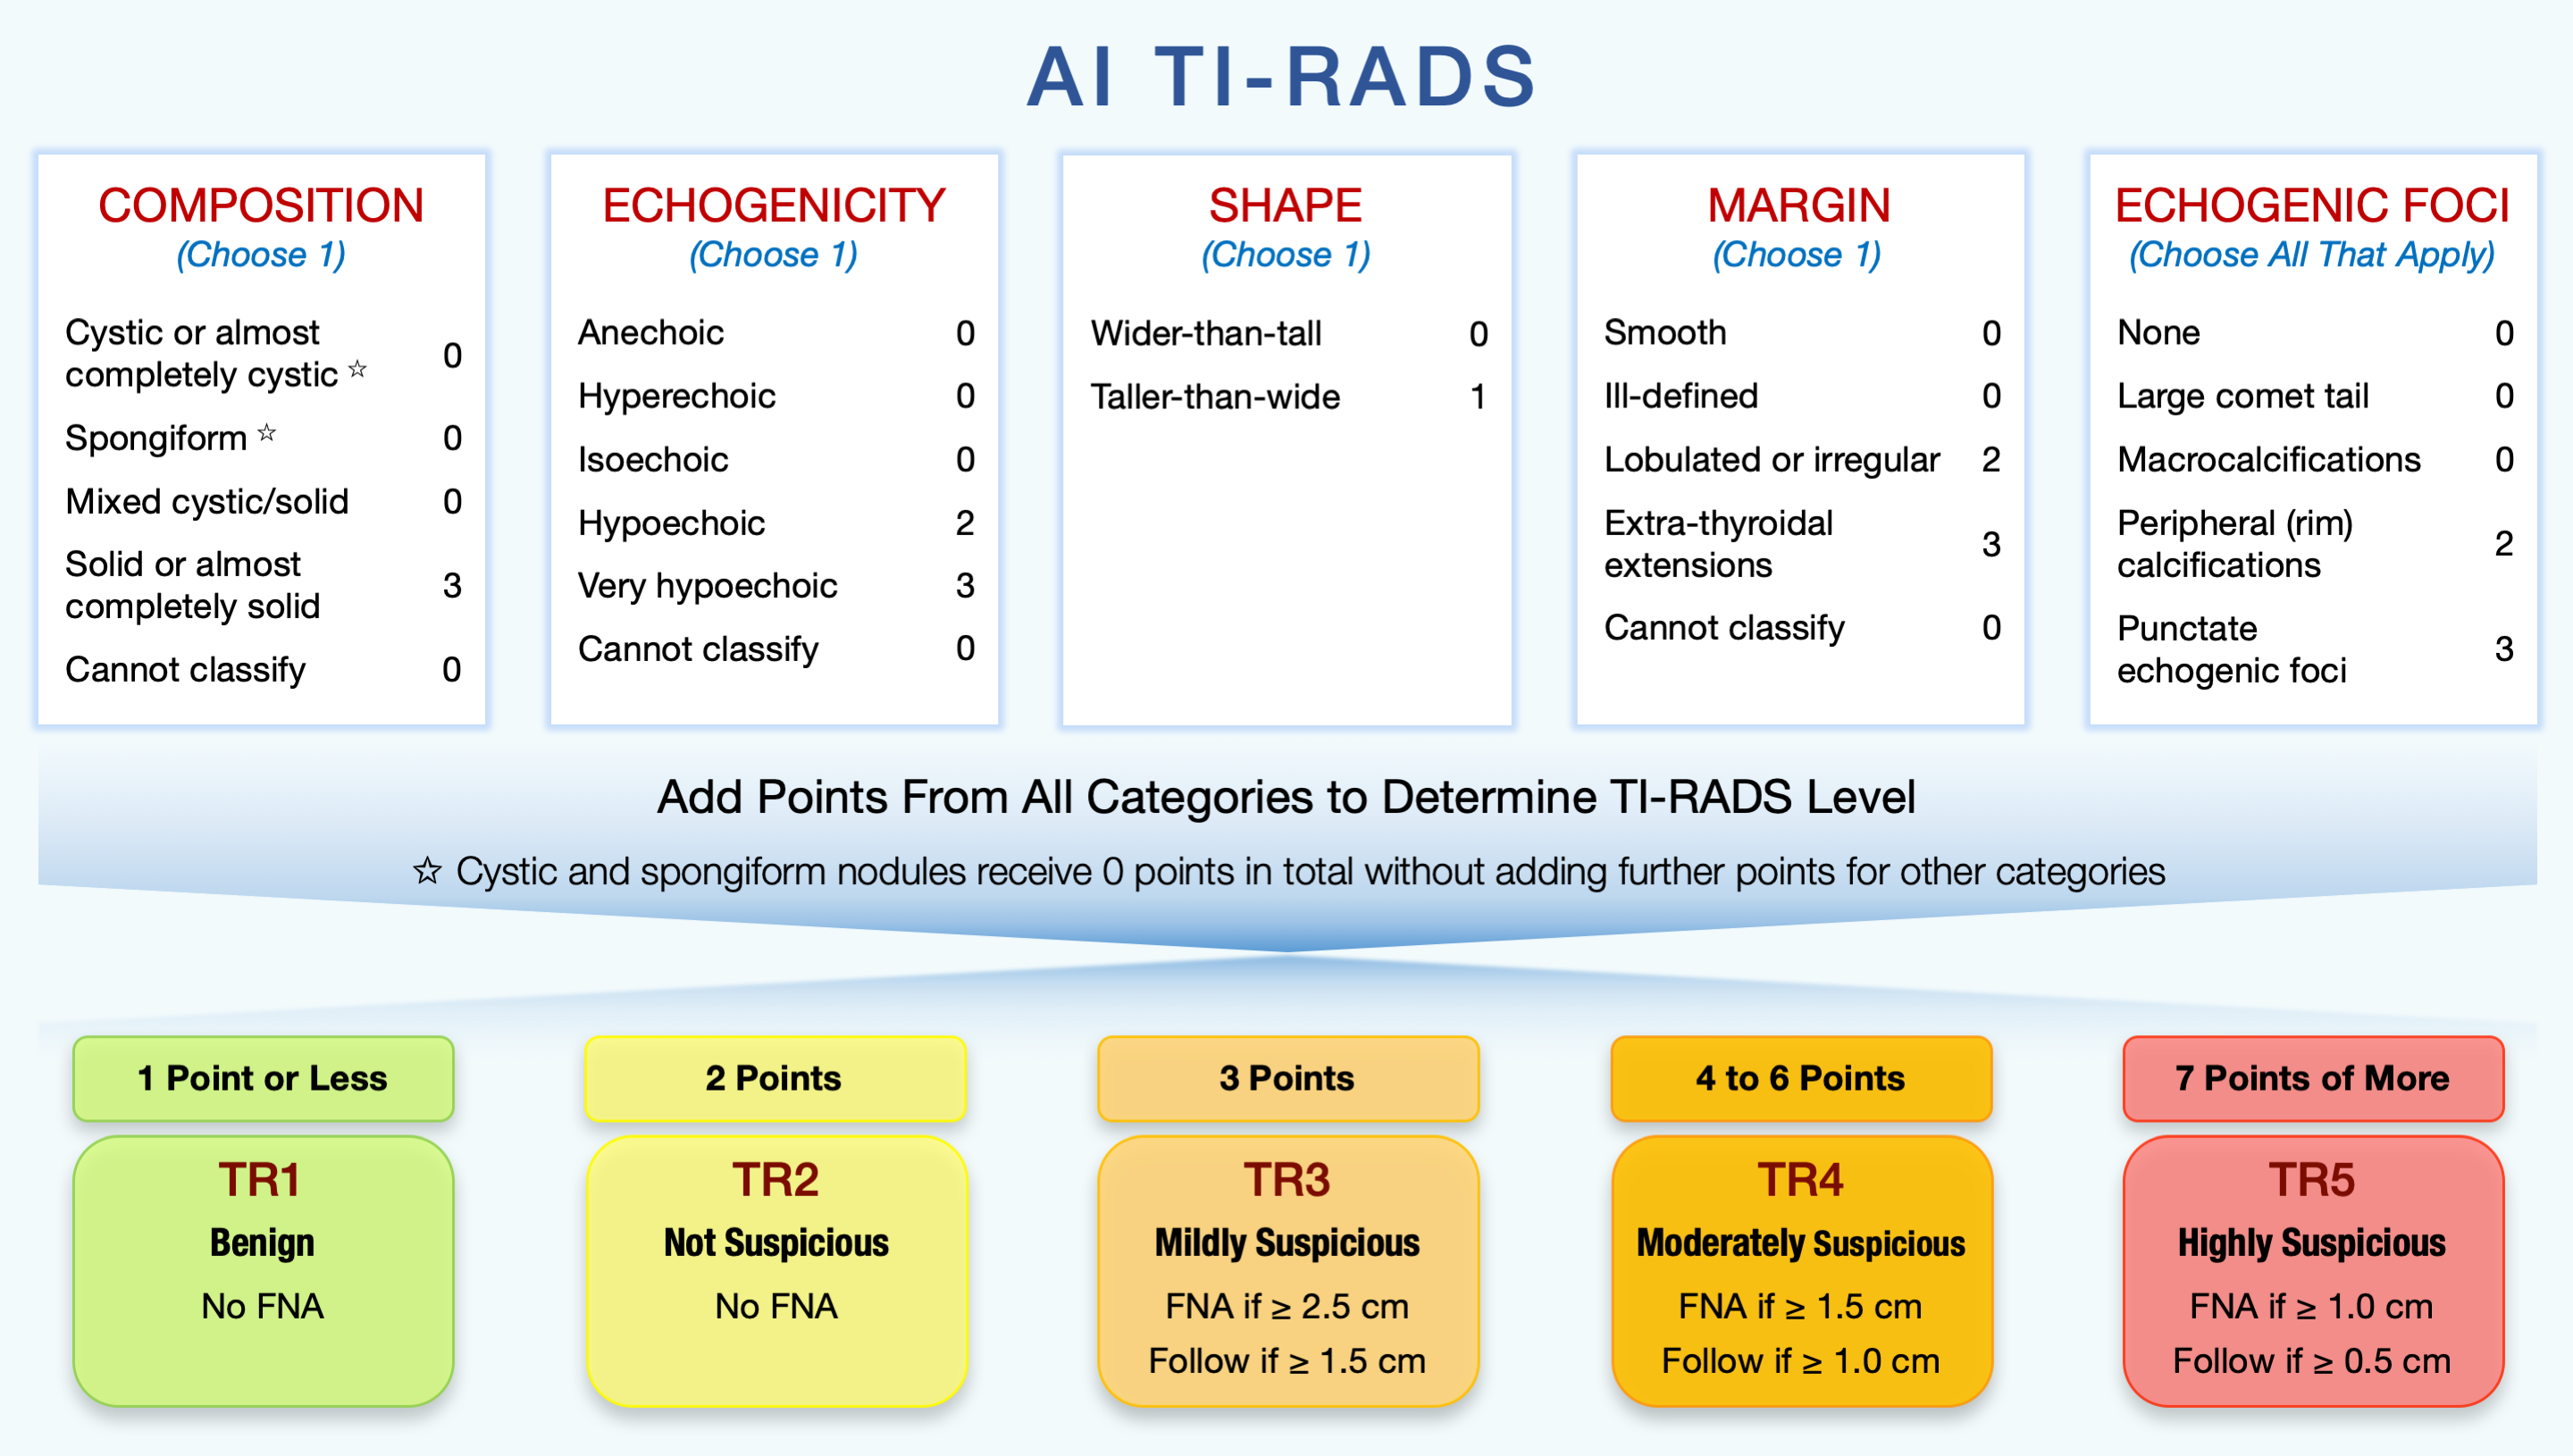
Figure 3: AI TI-RADS diagram from the Radiology article [2]. (FNA = fine needle aspiration biopsy)
On the training set, the AUC for ACR TI-RADS (used for initialization) was 0.79, whereas for AI TI-RADS it was 0.82.
The 100 test cases were assessed for the five ACR TI-RADS feature categories by (1) eight radiologists who interpreted thyroid ultrasound in clinical practice and (2) three ACR TI-RADS committee members whose interpretations were combined into expert consensus using majority vote. Based on these interpretations, we compared sensitivity and specificity for biopsy recommendation of ACR TI-RADS and AI TI-RADS on a boxplot shown in Figure 4.
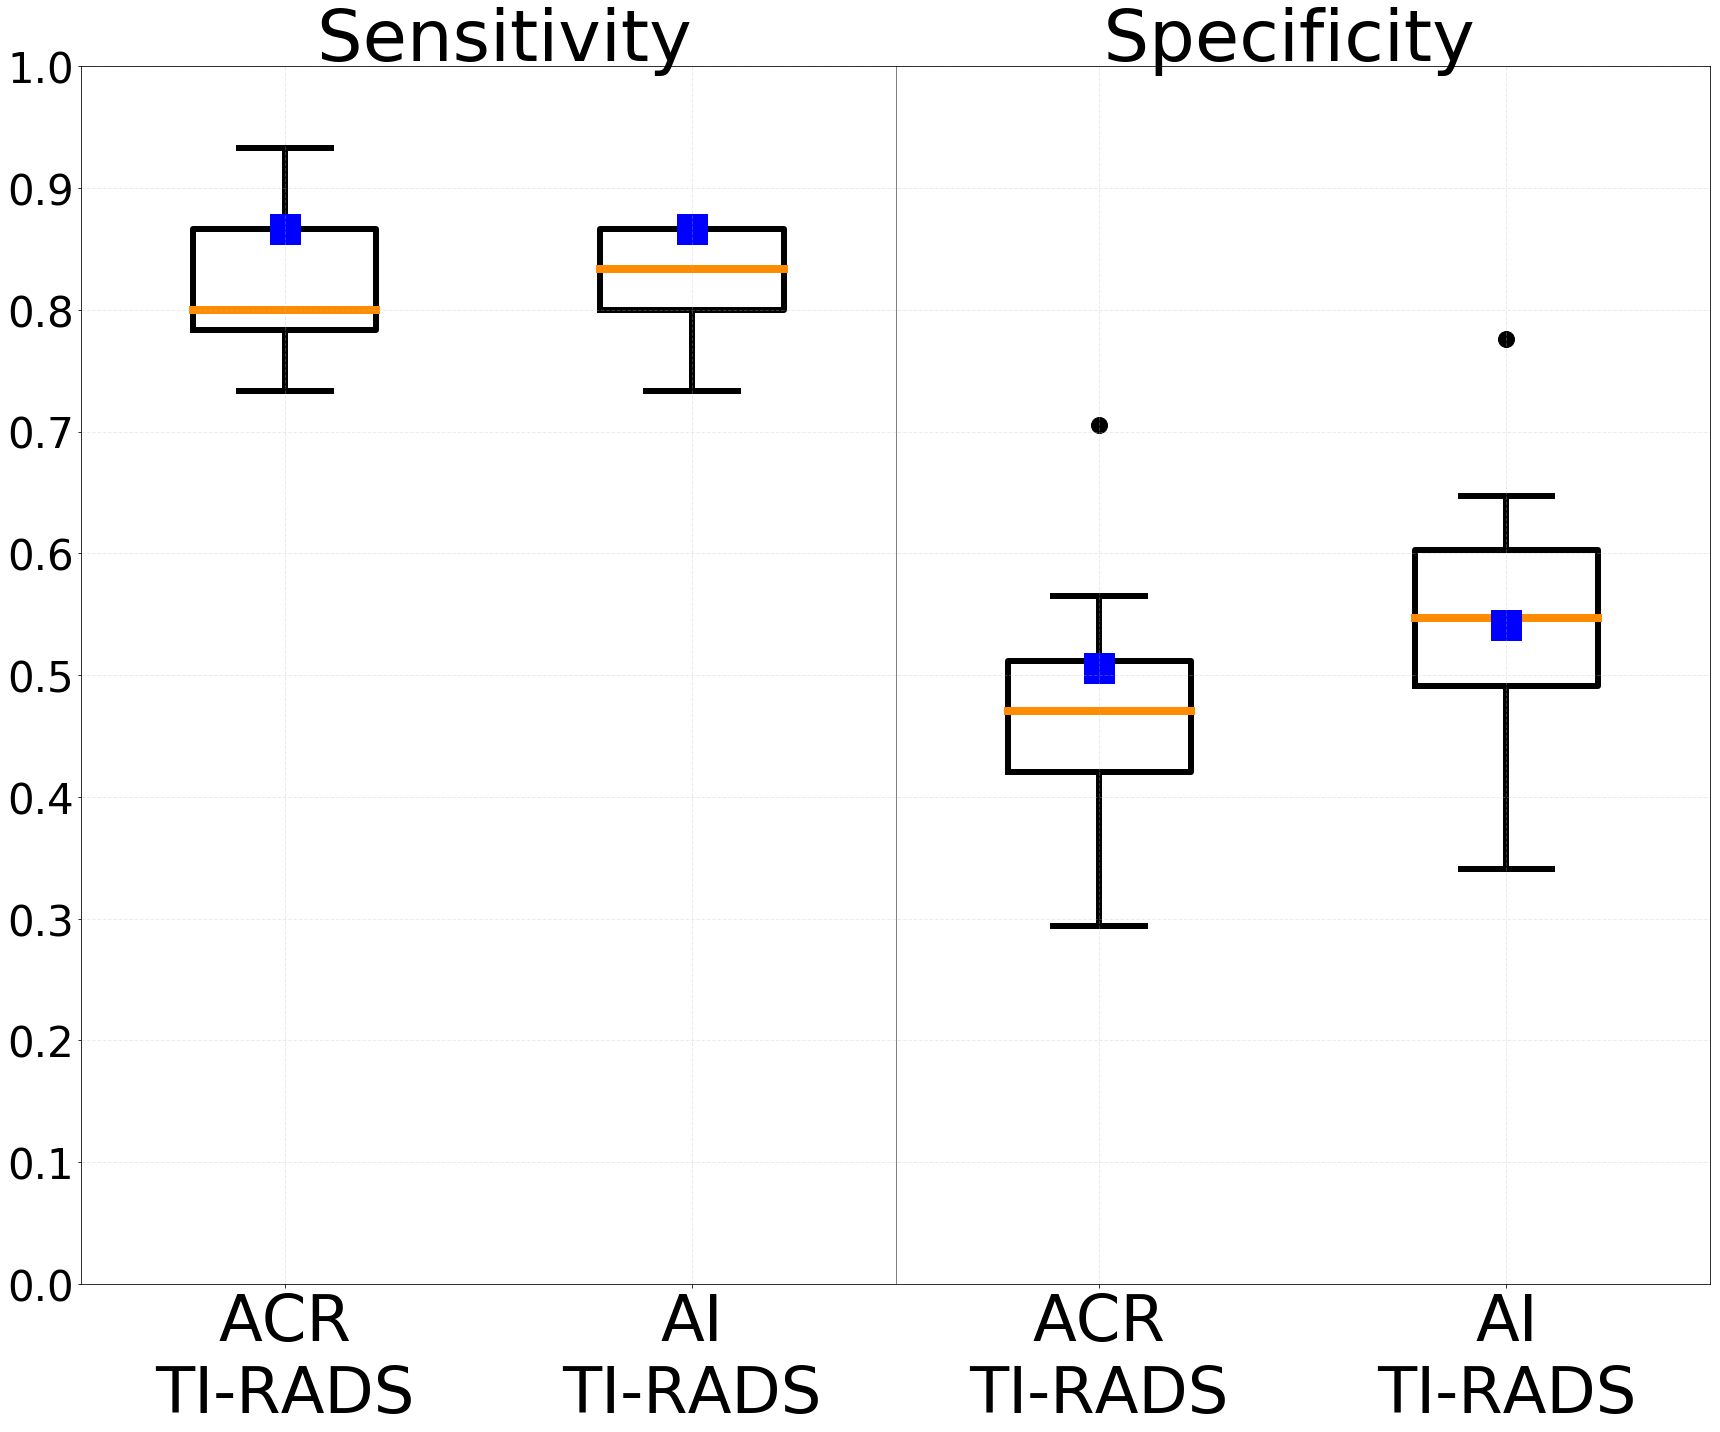
Figure 4: Comparison between ACR TI-RADS and AI TI-RADS in terms of sensitivity and specificity for biopsy recommendation on the 100 test cases. Boxes represent a set of eight radiologists and blue squares represent an expert consensus.
AI TI-RADS resulted in improved specificity for expert consensus from 50.6% to 54.1% (p=0.096) as well as for mean specificity of the eight radiologists from 47.7% to 55.3% (p<0.001). In terms of sensitivity, for expert consensus, it was the same for both TI-RADS (86.7%), whereas mean sensitivity of the eight radiologists slightly improved from 81.7% to 82.5% (p>0.5).
References
[1] Tessler FN, Middleton WD, Grant EG, Hoang JK, Berland LL, Teefey SA, et al. “ACR Thyroid Imaging, Reporting and Data System (TI-RADS): White Paper of the ACR TI-RADS Committee.” Journal of the American College of Radiology, 2017.
[2] Wildman-Tobriner B, Buda M, Hoang JK, Middleton WD, Thayer D, Short RG, Tessler FN, Mazurowski MA “Using Artificial Intelligence to Revise ACR TI-RADS Risk Stratification of Thyroid Nodules: Diagnostic Accuracy and Utility.” Radiology, 2019.
Links
- AI TI-RADS Radiology paper: doi.org/10.1148/radiol.2019182128.
- AI TI-RADS Calculator: deckard.duhs.duke.edu/~ai-ti-rads/.
- AI TI-RADS GitHub repository: github.com/mateuszbuda/AI-TI-RADS.
- Python DEAP package: deap.readthedocs.io.