Python toolset for statistical comparison of machine learning models and human readers
Introduction
The most common statistical methods for comparing machine learning models and human readers are p-value and confidence interval. Although receiving some criticism recently, p-value and confidence interval give more insight into results than a raw performance measure, if interpreted correctly, and are required by many journals.
This post shows an example python code utilizing bootstrapping for computing confidence intervals and p-values comparing machine learning models and human readers.
I will not discuss what p-value does or does not mean, what is the right threshold for statistical significance, or how to properly interpret it. Here are some resources that dive deeper into this topic:
- Wasserstein, R.L. and Lazar, N.A., 2016. The ASA’s statement on p-values: context, process, and purpose. The American Statistician, 70(2), pp.129-133.
- Baker, M., 2016. Statisticians issue warning over misuse of p-values. Nature News, 531(7593), p.151.
- Altman, N. and Krzywinski, M., 2016. Points of significance: p-values and the search for significance.
- Benjamin, D.J., Berger, J.O., Johannesson, M., Nosek, B.A., Wagenmakers, E.J., Berk, R., Bollen, K.A., Brembs, B., Brown, L., Camerer, C. and Cesarini, D., 2018. Redefine statistical significance. Nature Human Behaviour, 2(1), p.6.
- McShane, B.B., Gal, D., Gelman, A., Robert, C. and Tackett, J.L., 2019. Abandon statistical significance. The American Statistician, 73(sup1), pp.235-245.
Simple statistical toolset for machine learning
I published a GitHub repository ml-stat-util containing a set of simple functions written in Python for computing p-values and confidence intervals using bootstrapping. I will show how to use it in different common use cases.
A jupyter notebook with all use cases described below is available on GitHub.
Use case #1
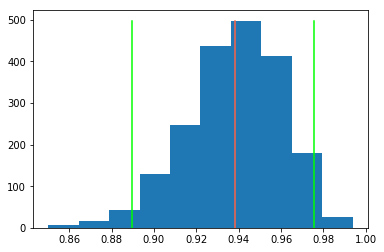
Compute AUC with 95% confidence interval for a single model.
from sklearn.metrics import roc_auc_score
import stat_util

score, ci_lower, ci_upper, scores = stat_util.score_ci(
    y_true, y_pred, score_fun=roc_auc_score
)
To get an idea of what happened, we can plot a histogram of bootstrapped scores.
import matplotlib.pyplot as plt

bins = plt.hist(scores)
plt.plot([score, score], [0, np.max(bins[0])], color="tomato")
plt.plot([ci_lower, ci_lower], [0, np.max(bins[0])], color="lime")
plt.plot([ci_upper, ci_upper], [0, np.max(bins[0])], color="lime")
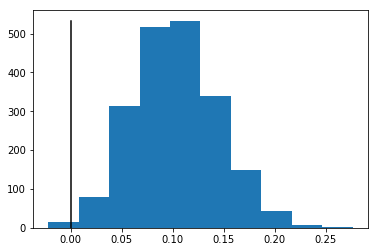
Use case #2
Compare two models by computing p-value for a difference in their performance measured with AUC.
from sklearn.metrics import roc_auc_score
import matplotlib.pyplot as plt
import stat_util

p, z = stat_util.pvalue(y_true, y_pred1, y_pred2, score_fun=roc_auc_score)
bins = plt.hist(z)
plt.plot([0, 0], [0, np.max(bins[0])], color="black")
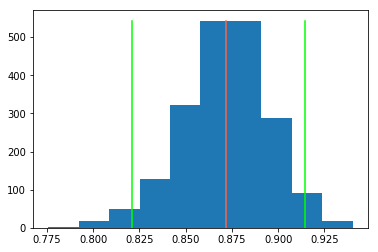
Use case #3
Compute mean AUC with 95% confidence interval for a set of readers/models.
import numpy as np
from sklearn.metrics import roc_auc_score
import matplotlib.pyplot as plt
import stat_util

mean_score, ci_lower, ci_upper, scores = stat_util.score_stat_ci(
    y_true, y_pred_readers, score_fun=roc_auc_score, stat_fun=np.mean
)
bins = plt.hist(scores)
plt.plot([mean_score, mean_score], [0, np.max(bins[0])], color="tomato")
plt.plot([ci_lower, ci_lower], [0, np.max(bins[0])], color="lime")
plt.plot([ci_upper, ci_upper], [0, np.max(bins[0])], color="lime")
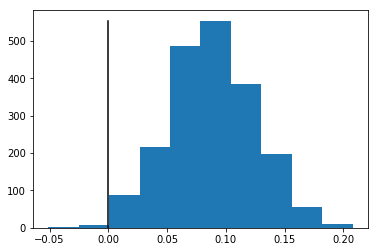
Use case #4
Compare a single model to a set of readers by computing p-value for a difference in their performance measured with AUC.
import numpy as np
from sklearn.metrics import roc_auc_score
import matplotlib.pyplot as plt
import stat_util

p, z = stat_util.pvalue_stat(
    y_true, y_pred, y_pred_readers, score_fun=roc_auc_score, stat_fun=np.mean
)
bins = plt.hist(z)
plt.plot([0, 0], [0, np.max(bins[0])], color="black")
Links
- Code: mateuszbuda/ml-stat-util
- Notebook: mateuszbuda/ml-stat-util/examples.ipynb